
Starting with data doesn’t just mean collecting it; more importantly, it involves analyzing the data to uncover patterns that guide subsequent work. This is a key insight I learned from a report by a planning director at Nestlé (as illustrated in the diagram).
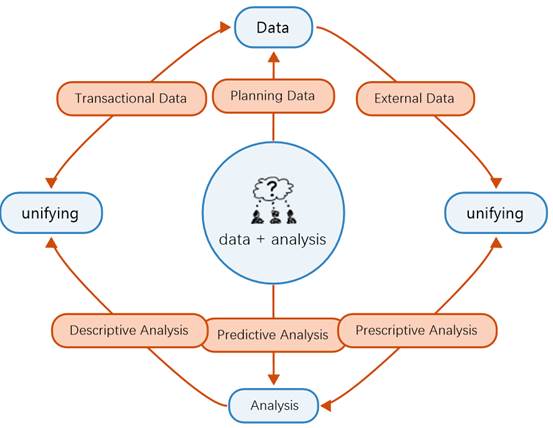
**Starting with data = data + analysis**
First, let’s discuss the data. Nestlé’s demand planning categorizes data into three levels: transactional data, planning data, and external data.
– **Transactional Data:** This consists of operational-level data, such as information related to orders, work orders, and inventory movements. It represents the most raw and basic data stored in ERP systems and can be seen as every action recorded within the information system. For instance, in the ERP software SAP, every movement of materials—including who moved them and from which storage location to another—has a clear record; customer orders, including when they were received and when they were shipped, are also typical examples of transactional data. Providing complete transactional data is a strong point of ERP systems.
– **Planning Data:** Transactional data cannot be utilized directly for planning; it requires further organization and cleaning. For instance, historical demand data must be compiled daily, weekly, or monthly and broken down by product line, product, or SKU, while filtering out one-time demand instances, thus converting it into data suitable for planning and further analysis. Planning data also includes master data such as procurement lead times, minimum order quantities, and suppliers. The source of planning data is ERP systems, but it is often stored in specialized planning systems or separate databases.
– **External Data:** This comes from third parties, such as e-commerce platforms and sales terminals. External data reflects demand more accurately and adds greater value to planning, although it is often harder to acquire. Additionally, industry research and third-party data are also categorized as external data. For example, before launching a new product, some companies may refer to industry research data to assess the potential market size and the market share they might gain to inform product forecasting.
As companies grow larger, the truth becomes obscured; the truth lies within the data. Of course, under the uncertainty principle, we may never fully grasp the “truth”; it is relative. More importantly, it is the truth recognized by the majority. Without common data, there is no shared truth, which leads to a lack of collaborative foundation. Planning data plays this role.
Although labeled “planning data,” it is not exclusively for the planning function; every manager engages in some form of planning, even if their title or role doesn’t explicitly include “planning.” For instance, production uses planning data to schedule future capacity; logistics use it for planning logistics costs; procurement relies on it to formulate purchasing plans and negotiate prices with suppliers; finance uses it to simulate cash flow; sales, of course, uses planning data to forecast revenue and arrange promotions and activities in a timely manner.
For enterprises, a significant challenge is having unified transactional data, as this is the raw record from the ERP system; however, without unified planning data, each function tends to operate independently. This issue affects both small and large enterprises alike. For example, a large electronics company with over 10 billion in revenue had headquarters and various regions that used different data sets—sales, product, planning, and supply chain all operated with their own data, while finance had its own data as well. Different sources and formats of data led to confusion and wasted time on data confirmation, leading to inefficiencies and complicated communication.
For instance, sales identifies demand based on the date an order is received, logistics bases demand on the actual shipping date, while demand planning identifies it based on the customer’s required date. A simple example is that if a customer places an order on February 15 for 100 units needed by March 15, but it is actually shipped on April 1, then according to the above logic, sales attributes the demand to February, planning to March, and logistics to April; this complicates communication between functions.
The solution is actually quite simple: build a unified planning data system that serves as a common language for all functions. Who should lead this effort? The planning function, particularly at the headquarters level. For example, in an e-commerce company, the planning team collaborates with finance (the planning team knows ERP systems best, while finance has the most reliable data) to establish a common planning database based on customer order-level data and place it on a unified server or cloud platform for all functions to access.
The basic assumption is that customer order data is authentic, including details like when the order was received, what product was ordered, how many were needed, the prices, and when it was to be shipped. This data serves as the basis for invoicing clients, which sales, customer service, logistics, and finance departments rely upon. From this foundational primary data, we can segment based on different dimensions—time, product, geography, and customer—similar to using a pivot table in Excel, turning it into data shared across functions.
In this e-commerce company, the planning team designates personnel to regularly update the database weekly with data from the previous week, allowing different functions, headquarters, and stores to utilize this common data. From a management perspective, weekly updates can meet the timeliness requirements of most functions. For daily replenishments, the update frequency should be higher, such as daily, wherein less data is updated each time.
Common planning data not only reduces communication costs between functions and between headquarters and branches, but also decreases the likelihood of errors in primary data, enhancing decision-making quality. With such data in place, planning personnel can analyze what has already happened (current state), forecast potential future scenarios (predictions), and finally propose actionable recommendations (action plans). These are known as descriptive analysis, predictive analysis, and prescriptive analysis, forming the three major analytical methods under “starting with data.”
– **Descriptive Analysis:** What is or has already happened. For example, using line graphs to determine if historical demand has trends, seasonality, or cycles; employing metrics such as standard deviation, volatility, and extreme values to assess historical demand fluctuations. Common indicators like average, median, and mode help us understand the demand volume.
– **Predictive Analysis:** What may happen. Building on descriptive analysis, statistical models are utilized to predict possible future events. This is the core of data analytics, wherein future predictions are made based on historical continuity and correlation. For example, if demand shows seasonality, historical data can be used to forecast future demand for several quarters. It’s important to note that predictive analysis relies on statistics to assess probabilities of demand falling within certain ranges.
– **Prescriptive Analysis:** This suggests action plans based on the previous two analyses. Using the medical analogy: descriptive analysis resembles “observing,” “listening,” and “questioning,” predictive analysis forecasts the course of a condition, while prescriptive analysis determines the treatment plan. Descriptive analysis focuses on what has “already happened,” predictive analysis looks at “what might happen,” and prescriptive analysis answers “what should we do,” providing concrete action plans for an uncertain future.
As planning personnel, regardless of the type of data analysis performed, we should be hypothesis-driven and business-guided, analyzing to solve business issues rather than analyzing for analysis’s sake. This also distinguishes planners from analysts: planners typically have a business background and tend to have hypotheses based on business angles that make the data analysis more targeted. In contrast, many analysts possess strong IT backgrounds but lack practical experience in demand forecasting, inventory planning, etc., resulting in analyses that produce numerous reports but do not solve any real issues.